

Hotspot monitoring using
nighttime GCOM-C SGLI images

 |
 |
Hotspot monitoring usingnighttime GCOM-C SGLI images |
 |
| Real Volc Home | nighttime GCOM-C SGLI images |
Philippines |  |
Volcanoes Babuyan_Claro Didicas Pinatubo Taal Mayon Bulusan Hibok_Hibok Canlaon |
Babuyan_Claro (068) | (Lat.,Long) = (19.523 , 121.94) Height= 1180 (m) | Last Update : 2025/07/04-13:50 | ||||
| R1.6Mx show textdata | 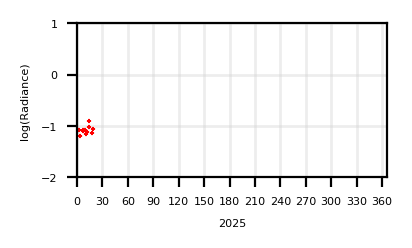 | 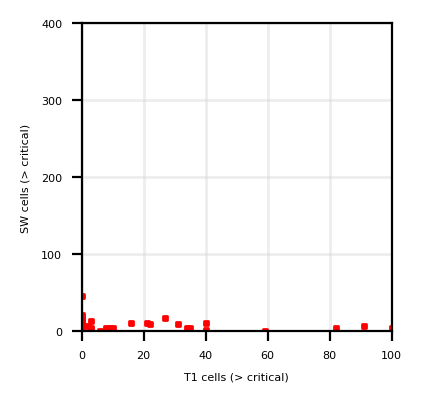 | ||||
| T11Mx | 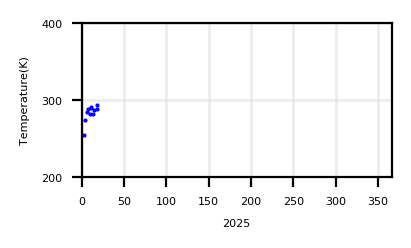 | |||||
| T11Sz,R1.6Sz | 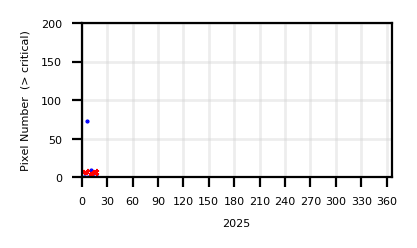 |
| ||||
| Show monthly chart | ||||||
2025/07/04-13:50 |
 |
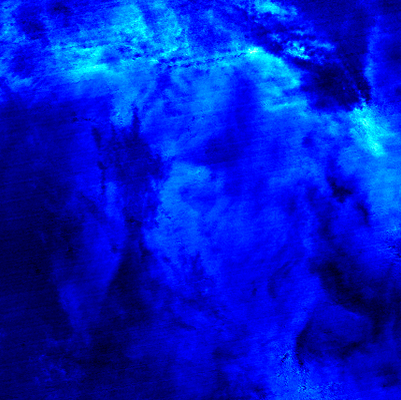 |
|
| T01 | SW03 | T01 - T02 | Google Maps |
Didicas (069) | (Lat.,Long) = (19.077 , 122.202) Height= 244 (m) | Last Update : 2025/07/04-13:50 | ||||
| R1.6Mx show textdata |  |  | ||||
| T11Mx |  | |||||
| T11Sz,R1.6Sz |  |
| ||||
| Show monthly chart | ||||||
2025/07/04-13:50 |
 |
 |
|
| T01 | SW03 | T01 - T02 | Google Maps |
Pinatubo (070) | (Lat.,Long) = (15.13 , 120.35) Height= 1600 (m) | Last Update : 2025/07/04-13:50 | ||||
| R1.6Mx show textdata |  |  | ||||
| T11Mx |  | |||||
| T11Sz,R1.6Sz |  |
| ||||
| Show monthly chart | ||||||
2025/07/04-13:50 |
 |
 |
|
| T01 | SW03 | T01 - T02 | Google Maps |
Taal (071) | (Lat.,Long) = (14.002 , 120.993) Height= 400 (m) | Last Update : 2025/07/04-13:50 | ||||
| R1.6Mx show textdata |  |  | ||||
| T11Mx |  | |||||
| T11Sz,R1.6Sz |  |
| ||||
| Show monthly chart | ||||||
2025/07/04-13:50 |
 |
 |
|
| T01 | SW03 | T01 - T02 | Google Maps |
Mayon (072) | (Lat.,Long) = (13.257 , 123.685) Height= 2462 (m) | Last Update : 2025/07/04-13:46 | ||||
| R1.6Mx show textdata |  |  | ||||
| T11Mx |  | |||||
| T11Sz,R1.6Sz |  |
| ||||
| Show monthly chart | ||||||
2025/07/04-13:46 |
 |
 |
|
| T01 | SW03 | T01 - T02 | Google Maps |
Bulusan (073) | (Lat.,Long) = (12.77 , 124.05) Height= 1565 (m) | Last Update : 2025/07/04-13:46 | ||||
| R1.6Mx show textdata |  |  | ||||
| T11Mx |  | |||||
| T11Sz,R1.6Sz |  |
| ||||
| Show monthly chart | ||||||
2025/07/04-13:46 |
 |
 |
|
| T01 | SW03 | T01 - T02 | Google Maps |
Hibok_Hibok (074) | (Lat.,Long) = (9.200556 , 124.668056) Height= _ (m) | Last Update : 2025/07/04-13:46 | ||||
| R1.6Mx show textdata |  |  | ||||
| T11Mx |  | |||||
| T11Sz,R1.6Sz |  |
| ||||
| Show monthly chart | ||||||
2025/07/04-13:46 |
 |
 |
|
| T01 | SW03 | T01 - T02 | Google Maps |
Canlaon (075) | (Lat.,Long) = (10.411592 , 123.133044) Height= _ (m) | Last Update : 2025/07/04-13:46 | ||||
| R1.6Mx show textdata |  |  | ||||
| T11Mx |  | |||||
| T11Sz,R1.6Sz |  |
| ||||
| Show monthly chart | ||||||
2025/07/04-13:46 |
 |
 |
|
| T01 | SW03 | T01 - T02 | Google Maps |