Hotspot monitoring using
nighttime GCOM-C SGLI images
|
Hotspot monitoring usingnighttime GCOM-C SGLI images |
||
| Real Volc Home | nighttime GCOM-C SGLI images |
Kyushu, Japan |  |
Volcanoes Kujyu Aso Unzen Kirishima Sakurajima Satsuma-Iwojima Kuchinoerabu-Jima Suwanose-Jima |
Kujyu (023) | (Lat.,Long) = (33.08 , 131.25) Height= 1787 (m) | Last Update : 2025/07/06-13:01 | ||||
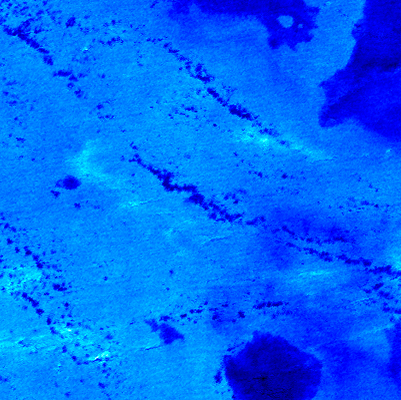
| R1.6Mx show textdata | 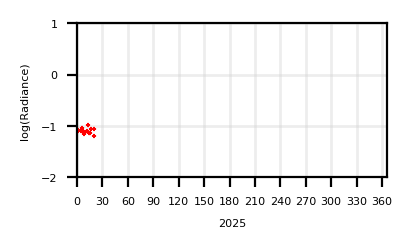 | 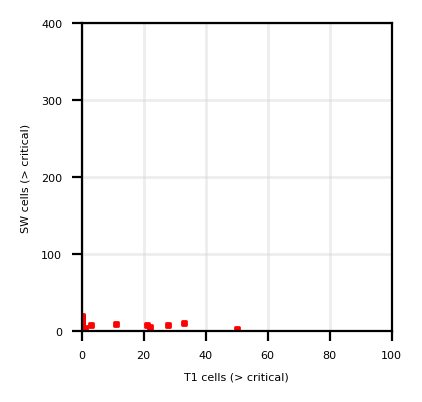 | ||||
| T11Mx | 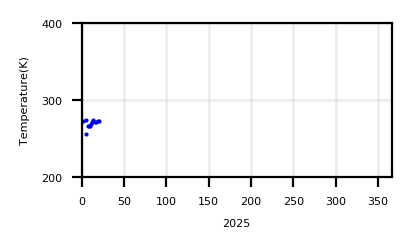 | |||||
| T11Sz,R1.6Sz |  |
| ||||
| Show monthly chart | ||||||
2025/07/06-13:01 |
 |
 |
|
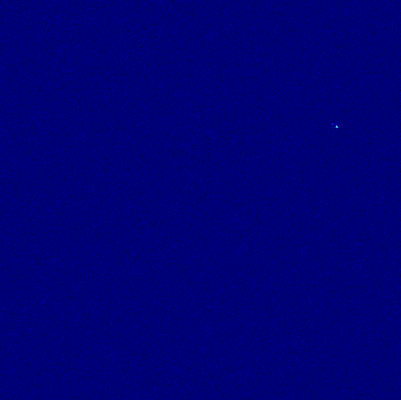
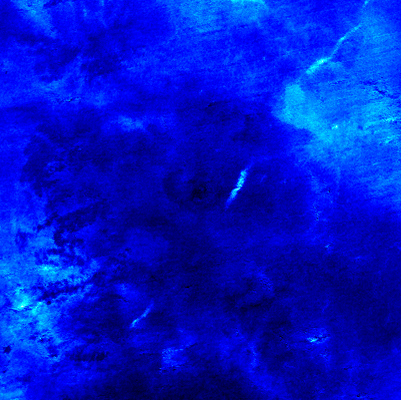
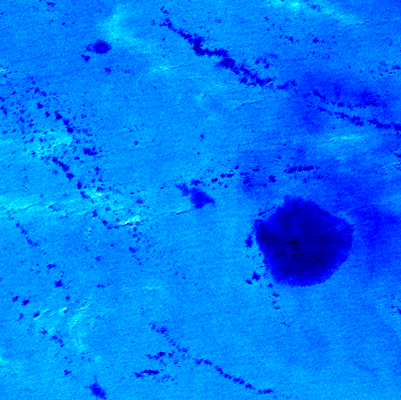
| T01 | SW03 | T01 - T02 | Google Maps |
Aso (024) | (Lat.,Long) = (32.88 , 131.1) Height= 1592 (m) | Last Update : 2025/07/06-13:01 | ||||
| R1.6Mx show textdata | 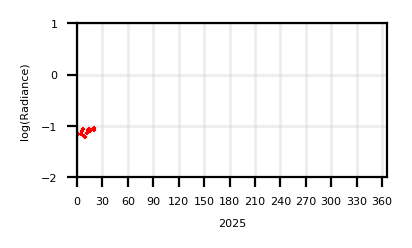 |  | ||||
| T11Mx | 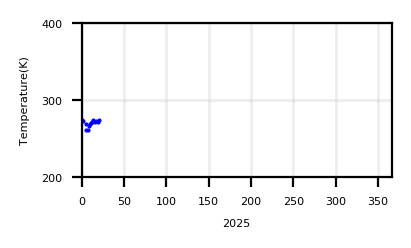 | |||||
| T11Sz,R1.6Sz |  |
| ||||
| Show monthly chart | ||||||
2025/07/06-13:01 |
 |
 |
|
| T01 | SW03 | T01 - T02 | Google Maps |
Unzen (025) | (Lat.,Long) = (32.75 , 130.3) Height= 1428 (m) | Last Update : 2025/07/06-13:01 | ||||
| R1.6Mx show textdata |  | 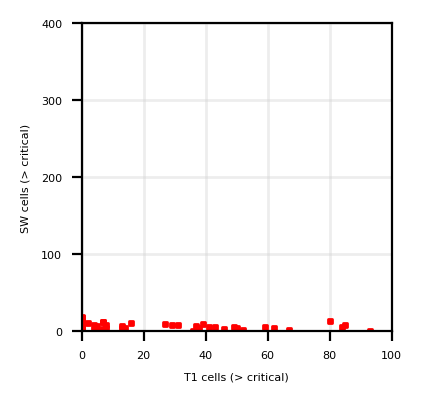 | ||||
| T11Mx | 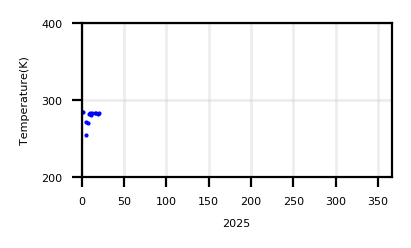 | |||||
| T11Sz,R1.6Sz |  |
| ||||
| Show monthly chart | ||||||
2025/07/06-13:01 |
 |
 |
|
| T01 | SW03 | T01 - T02 | Google Maps |
Kirishima (026) | (Lat.,Long) = (31.93 , 130.87) Height= 1700 (m) | Last Update : 2025/07/06-13:01 | ||||
| R1.6Mx show textdata |  | 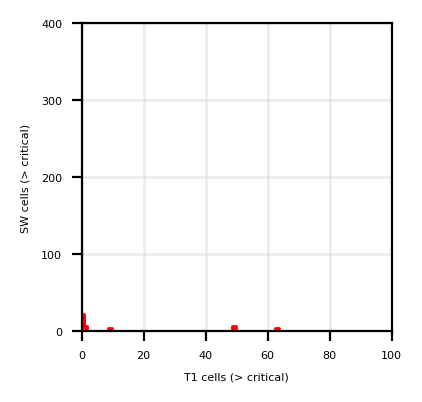 | ||||
| T11Mx | 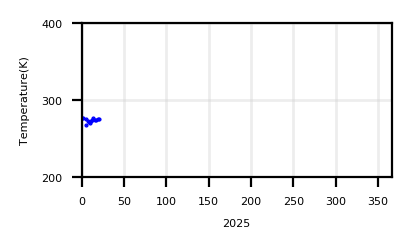 | |||||
| T11Sz,R1.6Sz |  |
| ||||
| Show monthly chart | ||||||
2025/07/06-13:01 |
 |
 |
|
| T01 | SW03 | T01 - T02 | Google Maps |
Sakurajima (027) | (Lat.,Long) = (31.58 , 130.67) Height= 1117 (m) | Last Update : 2025/07/06-13:01 | ||||
| R1.6Mx show textdata | 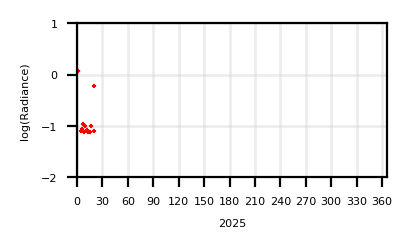 | 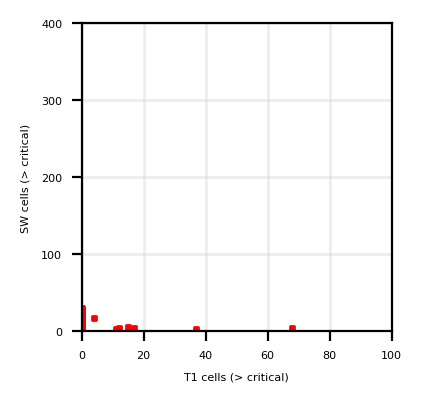 | ||||
| T11Mx | 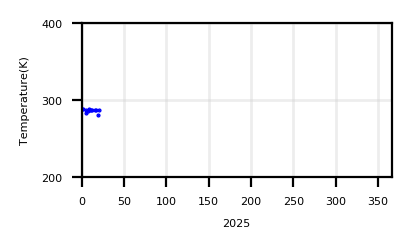 | |||||
| T11Sz,R1.6Sz | 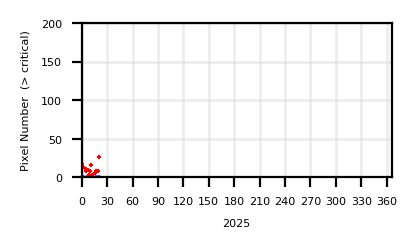 |
| ||||
| Show monthly chart | ||||||
2025/07/06-13:01 |
 |
 |
|
| T01 | SW03 | T01 - T02 | Google Maps |
Satsuma-Iwojima (028) | (Lat.,Long) = (30.78 , 130.28) Height= 704 (m) | Last Update : 2025/07/06-13:01 | ||||
| R1.6Mx show textdata |  |  | ||||
| T11Mx | 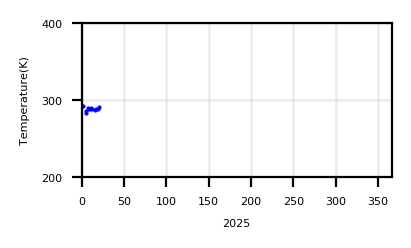 | |||||
| T11Sz,R1.6Sz | 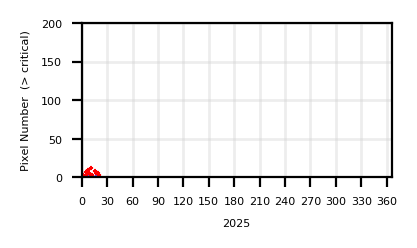 |
| ||||
| Show monthly chart | ||||||
2025/07/06-13:01 |
 |
 |
|
| T01 | SW03 | T01 - T02 | Google Maps |
Kuchinoerabu-Jima (029) | (Lat.,Long) = (30.43 , 130.22) Height= 633 (m) | Last Update : 2025/07/06-13:01 | ||||
| R1.6Mx show textdata | 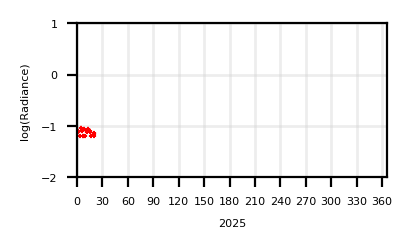 | 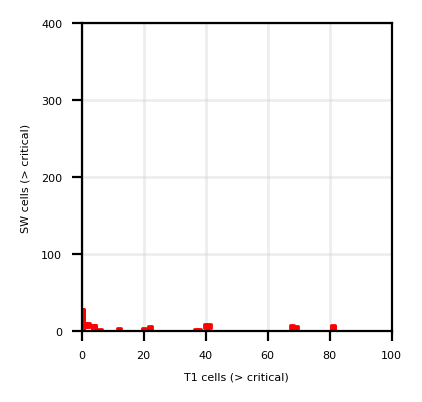 | ||||
| T11Mx | 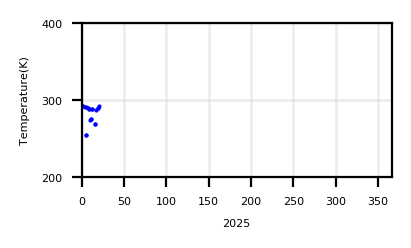 | |||||
| T11Sz,R1.6Sz |  |
| ||||
| Show monthly chart | ||||||
2025/07/06-13:01 |
 |
 |
|
| T01 | SW03 | T01 - T02 | Google Maps |
Suwanose-Jima (030) | (Lat.,Long) = (29.638 , 129.714) Height= 790 (m) | Last Update : 2025/07/06-13:01 | ||||
| R1.6Mx show textdata |  | 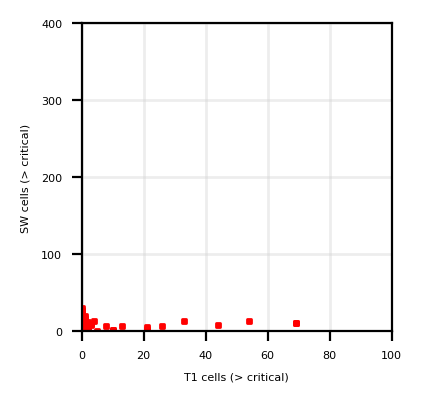 | ||||
| T11Mx | 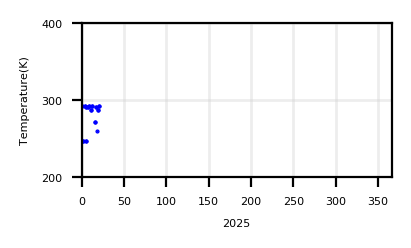 | |||||
| T11Sz,R1.6Sz |  |
| ||||
| Show monthly chart | ||||||
2025/07/06-13:01 |
 |
 |
|
| T01 | SW03 | T01 - T02 | Google Maps |