 |
Realvolc Home | GMS 地域選択 |
Sumatera | UPDATE: 2025-07-07 08:29:57 (JST, +9h UTC) |
 | [ Peuet_Sague ][ Telong ][ Sorikmarapi ][ Marapi ][ Tandikat ][ Talang ][ Kerinci ][ Kaba ][ Dempo ][ Suoh ][ Shinabung ] |
|
Realvolc Home | GMS 地域選択 |
Sumatera | UPDATE: 2025-07-07 08:29:57 (JST, +9h UTC) |
| [ Peuet_Sague ][ Telong ][ Sorikmarapi ][ Marapi ][ Tandikat ][ Talang ][ Kerinci ][ Kaba ][ Dempo ][ Suoh ][ Shinabung ] |
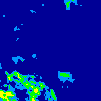
2025/07/06:21h30m UTC |
| ||||||||||||||||||||||||||||
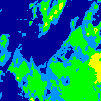
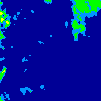
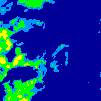
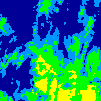
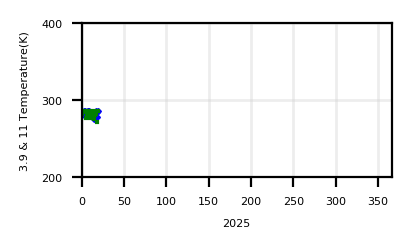
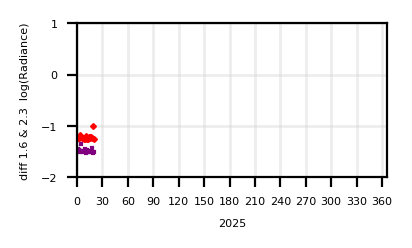
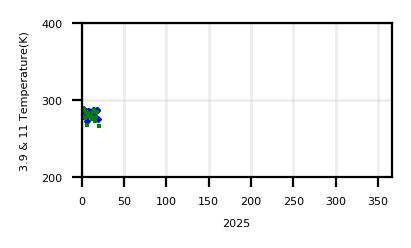
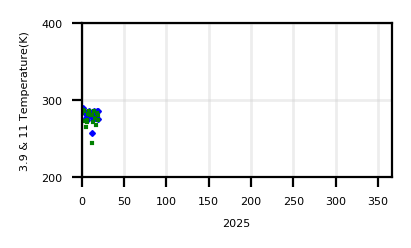
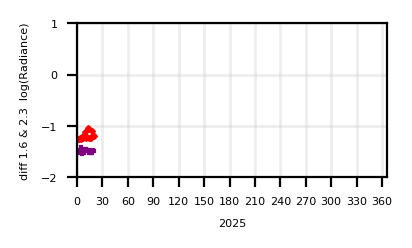
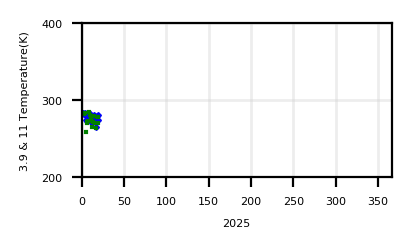
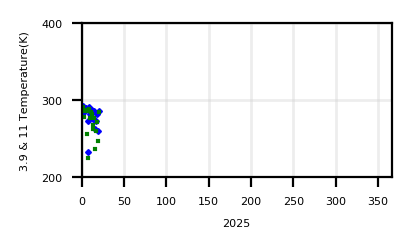
Peuet_Sague | |||||||||||||||||||||||||||||
| Lat. : 4.925 | |||||||||||||||||||||||||||||
| Long. : 96.33 | |||||||||||||||||||||||||||||
| Height(m) : 2780 | |||||||||||||||||||||||||||||
| annual chart (download textdata [1.6] [2.3] [3.9] [11] ) |
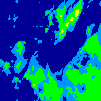
Latest Image 2025/07/06:21h30m UTC
| ||||||||||||||||||||||||||||
 | |||||||||||||||||||||||||||||
 | |||||||||||||||||||||||||||||
| show monthly chart | show daily chart | ||||||||||||||||||||||||||||
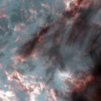
2025/07/06:21h30m UTC |
| ||||||||||||||||||||||||||||
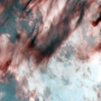
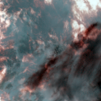
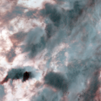
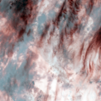
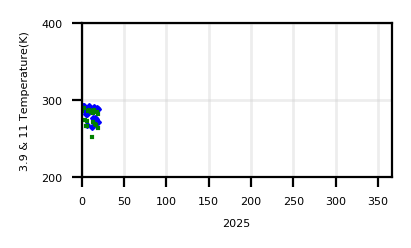
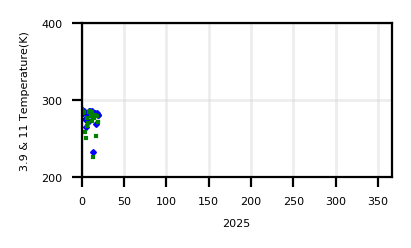
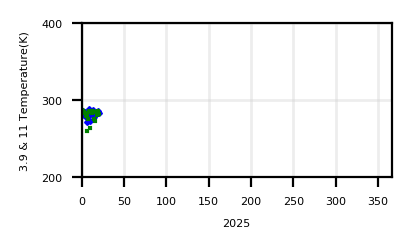
Telong | |||||||||||||||||||||||||||||
| Lat. : 4.77 | |||||||||||||||||||||||||||||
| Long. : 96.808 | |||||||||||||||||||||||||||||
| Height(m) : 2624 | |||||||||||||||||||||||||||||
| annual chart (download textdata [1.6] [2.3] [3.9] [11] ) |
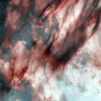
Latest Image 2025/07/06:21h30m UTC
| ||||||||||||||||||||||||||||
 | |||||||||||||||||||||||||||||
 | |||||||||||||||||||||||||||||
| show monthly chart | show daily chart | ||||||||||||||||||||||||||||
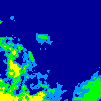
2025/07/06:21h30m UTC |
| ||||||||||||||||||||||||||||
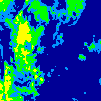
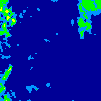
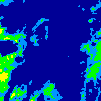
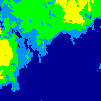
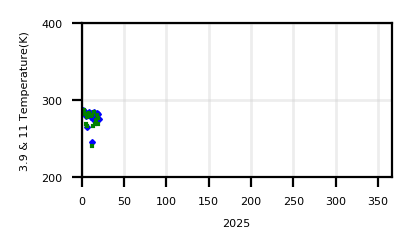
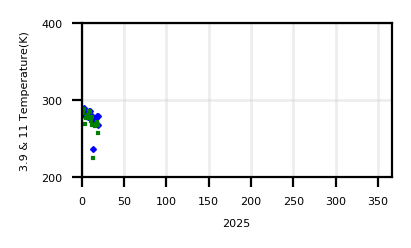
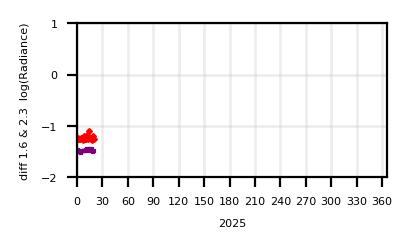
Sorikmarapi | |||||||||||||||||||||||||||||
| Lat. : 0.687 | |||||||||||||||||||||||||||||
| Long. : 99.537 | |||||||||||||||||||||||||||||
| Height(m) : 2145 | |||||||||||||||||||||||||||||
| annual chart (download textdata [1.6] [2.3] [3.9] [11] ) |
Latest Image 2025/07/06:21h30m UTC
| ||||||||||||||||||||||||||||
 | |||||||||||||||||||||||||||||
 | |||||||||||||||||||||||||||||
| show monthly chart | show daily chart | ||||||||||||||||||||||||||||
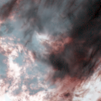
2025/07/06:21h30m UTC |
| ||||||||||||||||||||||||||||
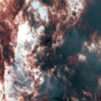
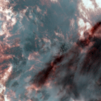
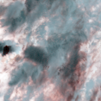
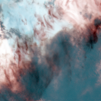
Marapi | |||||||||||||||||||||||||||||
| Lat. : -0.38 | |||||||||||||||||||||||||||||
| Long. : 100.471 | |||||||||||||||||||||||||||||
| Height(m) : 2891 | |||||||||||||||||||||||||||||
| annual chart (download textdata [1.6] [2.3] [3.9] [11] ) |
Latest Image 2025/07/06:21h30m UTC
| ||||||||||||||||||||||||||||
 | |||||||||||||||||||||||||||||
 | |||||||||||||||||||||||||||||
| show monthly chart | show daily chart | ||||||||||||||||||||||||||||
2025/07/06:21h30m UTC |
| ||||||||||||||||||||||||||||
Tandikat | |||||||||||||||||||||||||||||
| Lat. : -0.433 | |||||||||||||||||||||||||||||
| Long. : 100.317 | |||||||||||||||||||||||||||||
| Height(m) : 2438 | |||||||||||||||||||||||||||||
| annual chart (download textdata [1.6] [2.3] [3.9] [11] ) |
Latest Image 2025/07/06:21h30m UTC
| ||||||||||||||||||||||||||||
 | |||||||||||||||||||||||||||||
 | |||||||||||||||||||||||||||||
| show monthly chart | show daily chart | ||||||||||||||||||||||||||||
2025/07/06:21h30m UTC |
| ||||||||||||||||||||||||||||
Talang | |||||||||||||||||||||||||||||
| Lat. : -0.978 | |||||||||||||||||||||||||||||
| Long. : 100.679 | |||||||||||||||||||||||||||||
| Height(m) : 2896 | |||||||||||||||||||||||||||||
| annual chart (download textdata [1.6] [2.3] [3.9] [11] ) |
Latest Image 2025/07/06:21h30m UTC
| ||||||||||||||||||||||||||||
 | |||||||||||||||||||||||||||||
 | |||||||||||||||||||||||||||||
| show monthly chart | show daily chart | ||||||||||||||||||||||||||||
2025/07/06:21h30m UTC |
| ||||||||||||||||||||||||||||
Kerinci | |||||||||||||||||||||||||||||
| Lat. : -1.692 | |||||||||||||||||||||||||||||
| Long. : 101.27 | |||||||||||||||||||||||||||||
| Height(m) : 3805 | |||||||||||||||||||||||||||||
| annual chart (download textdata [1.6] [2.3] [3.9] [11] ) |
Latest Image 2025/07/06:21h30m UTC
| ||||||||||||||||||||||||||||
 | |||||||||||||||||||||||||||||
 | |||||||||||||||||||||||||||||
| show monthly chart | show daily chart | ||||||||||||||||||||||||||||
2025/07/06:21h30m UTC |
| ||||||||||||||||||||||||||||
Kaba | |||||||||||||||||||||||||||||
| Lat. : -3.52 | |||||||||||||||||||||||||||||
| Long. : 102.62 | |||||||||||||||||||||||||||||
| Height(m) : 1952 | |||||||||||||||||||||||||||||
| annual chart (download textdata [1.6] [2.3] [3.9] [11] ) |
Latest Image 2025/07/06:21h30m UTC
| ||||||||||||||||||||||||||||
 | |||||||||||||||||||||||||||||
 | |||||||||||||||||||||||||||||
| show monthly chart | show daily chart | ||||||||||||||||||||||||||||
2025/07/06:21h30m UTC |
| ||||||||||||||||||||||||||||
Dempo | |||||||||||||||||||||||||||||
| Lat. : -4.03 | |||||||||||||||||||||||||||||
| Long. : 103.13 | |||||||||||||||||||||||||||||
| Height(m) : 3173 | |||||||||||||||||||||||||||||
| annual chart (download textdata [1.6] [2.3] [3.9] [11] ) |
Latest Image 2025/07/06:21h30m UTC
| ||||||||||||||||||||||||||||
 | |||||||||||||||||||||||||||||
 | |||||||||||||||||||||||||||||
| show monthly chart | show daily chart | ||||||||||||||||||||||||||||
2025/07/06:21h30m UTC |
| ||||||||||||||||||||||||||||
Suoh | |||||||||||||||||||||||||||||
| Lat. : -5.25 | |||||||||||||||||||||||||||||
| Long. : 104.27 | |||||||||||||||||||||||||||||
| Height(m) : 1000 | |||||||||||||||||||||||||||||
| annual chart (download textdata [1.6] [2.3] [3.9] [11] ) |
Latest Image 2025/07/06:21h30m UTC
| ||||||||||||||||||||||||||||
 | |||||||||||||||||||||||||||||
 | |||||||||||||||||||||||||||||
| show monthly chart | show daily chart | ||||||||||||||||||||||||||||
2025/07/06:21h30m UTC |
| ||||||||||||||||||||||||||||
Shinabung | |||||||||||||||||||||||||||||
| Lat. : 3.169635 | |||||||||||||||||||||||||||||
| Long. : 98.393034 | |||||||||||||||||||||||||||||
| Height(m) : _ | |||||||||||||||||||||||||||||
| annual chart (download textdata [1.6] [2.3] [3.9] [11] ) |
Latest Image 2025/07/06:21h30m UTC
| ||||||||||||||||||||||||||||
 | |||||||||||||||||||||||||||||
 | |||||||||||||||||||||||||||||
| show monthly chart | show daily chart | ||||||||||||||||||||||||||||

 Go Energy_Cone