 |
Realvolc Home | GMS 地域選択 |
|
Realvolc Home | GMS 地域選択 |
2025/07/05:21h50m UTC |
| ||||||||||||||||||||||||||||
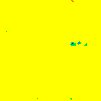
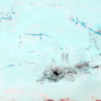
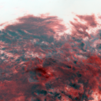
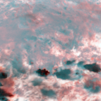
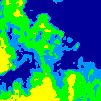
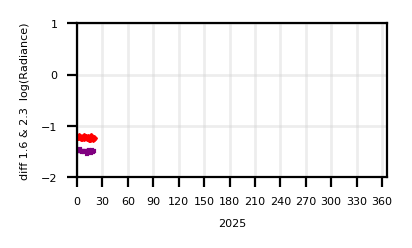
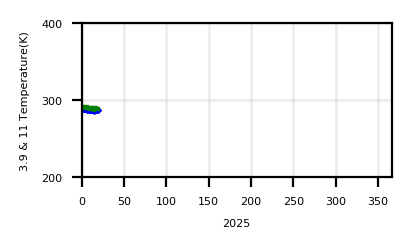
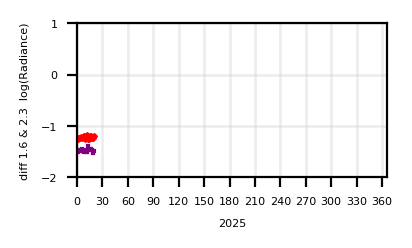
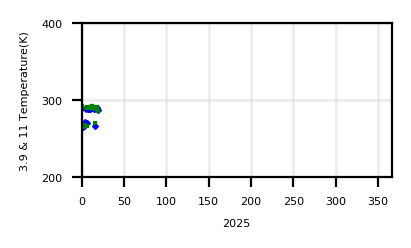
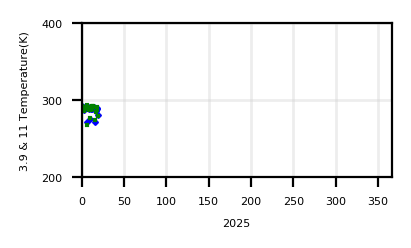
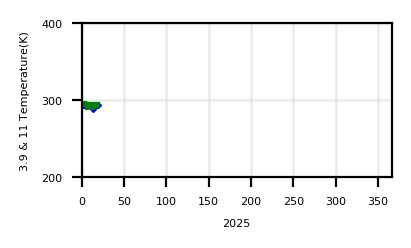
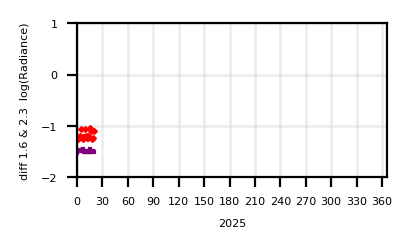
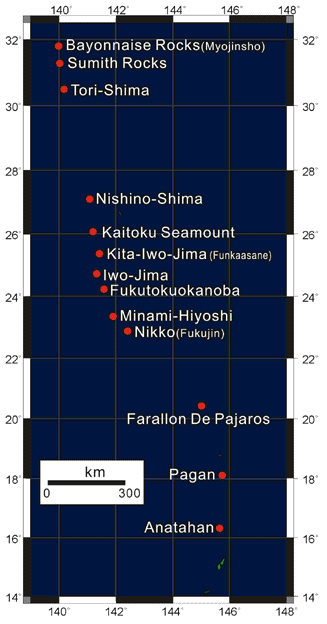
Bayonnaise Rocks(Myojinsho) | |||||||||||||||||||||||||||||
| Lat. : 31.88 | |||||||||||||||||||||||||||||
| Long. : 139.92 | |||||||||||||||||||||||||||||
| Height(m) : _ | |||||||||||||||||||||||||||||
| annual chart (download textdata [1.6] [2.3] [3.9] [11] ) |
Latest Image 2025/07/05:21h50m UTC
| ||||||||||||||||||||||||||||
 | |||||||||||||||||||||||||||||
 | |||||||||||||||||||||||||||||
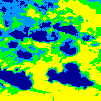
| show monthly chart | show daily chart | ||||||||||||||||||||||||||||
2025/07/05:21h50m UTC |
| ||||||||||||||||||||||||||||
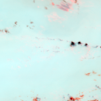
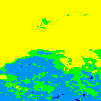
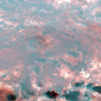
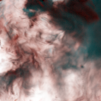
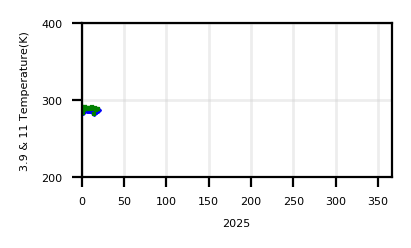
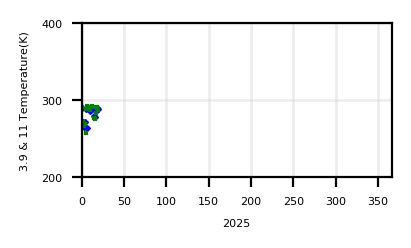
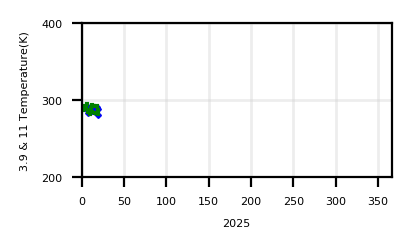
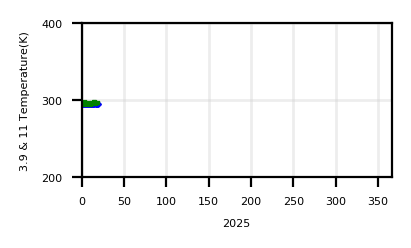
Sumith Rocks | |||||||||||||||||||||||||||||
| Lat. : 31.436 | |||||||||||||||||||||||||||||
| Long. : 140.054 | |||||||||||||||||||||||||||||
| Height(m) : _ | |||||||||||||||||||||||||||||
| annual chart (download textdata [1.6] [2.3] [3.9] [11] ) |
Latest Image 2025/07/05:21h50m UTC
| ||||||||||||||||||||||||||||
 | |||||||||||||||||||||||||||||
 | |||||||||||||||||||||||||||||
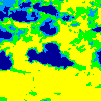
| show monthly chart | show daily chart | ||||||||||||||||||||||||||||
2025/07/05:21h50m UTC |
| ||||||||||||||||||||||||||||
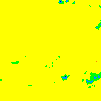
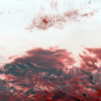
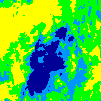
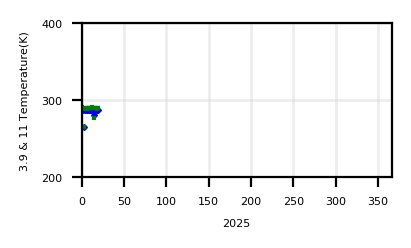
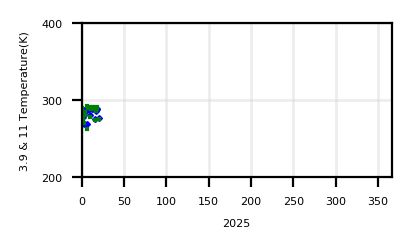
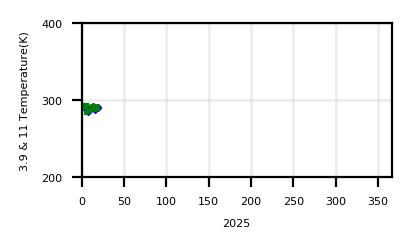
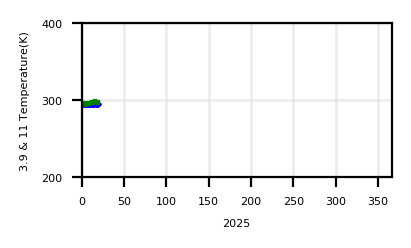
Tori-Shima | |||||||||||||||||||||||||||||
| Lat. : 30.48 | |||||||||||||||||||||||||||||
| Long. : 140.306 | |||||||||||||||||||||||||||||
| Height(m) : _ | |||||||||||||||||||||||||||||
| annual chart (download textdata [1.6] [2.3] [3.9] [11] ) |
Latest Image 2025/07/05:21h50m UTC
| ||||||||||||||||||||||||||||
 | |||||||||||||||||||||||||||||
 | |||||||||||||||||||||||||||||
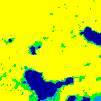
| show monthly chart | show daily chart | ||||||||||||||||||||||||||||
2025/07/05:21h50m UTC |
| ||||||||||||||||||||||||||||
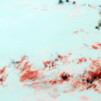
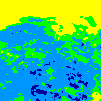
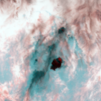
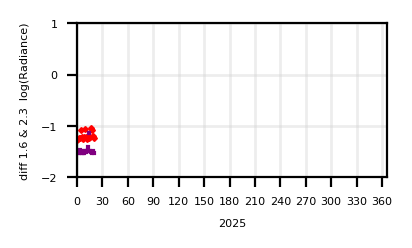
Nishino-Shima | |||||||||||||||||||||||||||||
| Lat. : 27.274 | |||||||||||||||||||||||||||||
| Long. : 140.882 | |||||||||||||||||||||||||||||
| Height(m) : _ | |||||||||||||||||||||||||||||
| annual chart (download textdata [1.6] [2.3] [3.9] [11] ) |
Latest Image 2025/07/05:21h50m UTC
| ||||||||||||||||||||||||||||
 | |||||||||||||||||||||||||||||
 | |||||||||||||||||||||||||||||
| show monthly chart | show daily chart | ||||||||||||||||||||||||||||
2025/07/05:21h50m UTC |
| ||||||||||||||||||||||||||||
Kaitoku Seamount | |||||||||||||||||||||||||||||
| Lat. : 26.122 | |||||||||||||||||||||||||||||
| Long. : 141.102 | |||||||||||||||||||||||||||||
| Height(m) : _ | |||||||||||||||||||||||||||||
| annual chart (download textdata [1.6] [2.3] [3.9] [11] ) |
Latest Image 2025/07/05:21h50m UTC
| ||||||||||||||||||||||||||||
 | |||||||||||||||||||||||||||||
 | |||||||||||||||||||||||||||||
| show monthly chart | show daily chart | ||||||||||||||||||||||||||||
2025/07/05:21h50m UTC |
| ||||||||||||||||||||||||||||
Kita-Iwo-Jima (Funkaasane) | |||||||||||||||||||||||||||||
| Lat. : 25.424 | |||||||||||||||||||||||||||||
| Long. : 141.284 | |||||||||||||||||||||||||||||
| Height(m) : _ | |||||||||||||||||||||||||||||
| annual chart (download textdata [1.6] [2.3] [3.9] [11] ) |
Latest Image 2025/07/05:21h50m UTC
| ||||||||||||||||||||||||||||
 | |||||||||||||||||||||||||||||
 | |||||||||||||||||||||||||||||
| show monthly chart | show daily chart | ||||||||||||||||||||||||||||
2025/07/05:21h50m UTC |
| ||||||||||||||||||||||||||||
Iwo-Jima | |||||||||||||||||||||||||||||
| Lat. : 24.754 | |||||||||||||||||||||||||||||
| Long. : 141.29 | |||||||||||||||||||||||||||||
| Height(m) : _ | |||||||||||||||||||||||||||||
| annual chart (download textdata [1.6] [2.3] [3.9] [11] ) |
Latest Image 2025/07/05:21h50m UTC
| ||||||||||||||||||||||||||||
 | |||||||||||||||||||||||||||||
 | |||||||||||||||||||||||||||||
| show monthly chart | show daily chart | ||||||||||||||||||||||||||||
2025/07/05:21h50m UTC |
| ||||||||||||||||||||||||||||
Fukutokuokanoba | |||||||||||||||||||||||||||||
| Lat. : 24.28 | |||||||||||||||||||||||||||||
| Long. : 141.485 | |||||||||||||||||||||||||||||
| Height(m) : _ | |||||||||||||||||||||||||||||
| annual chart (download textdata [1.6] [2.3] [3.9] [11] ) |
Latest Image 2025/07/05:21h50m UTC
| ||||||||||||||||||||||||||||
 | |||||||||||||||||||||||||||||
 | |||||||||||||||||||||||||||||
| show monthly chart | show daily chart | ||||||||||||||||||||||||||||
2025/07/05:21h50m UTC |
| ||||||||||||||||||||||||||||
Minami-Hiyoshi | |||||||||||||||||||||||||||||
| Lat. : 23.497 | |||||||||||||||||||||||||||||
| Long. : 141.94 | |||||||||||||||||||||||||||||
| Height(m) : _ | |||||||||||||||||||||||||||||
| annual chart (download textdata [1.6] [2.3] [3.9] [11] ) |
Latest Image 2025/07/05:21h50m UTC
| ||||||||||||||||||||||||||||
 | |||||||||||||||||||||||||||||
 | |||||||||||||||||||||||||||||
| show monthly chart | show daily chart | ||||||||||||||||||||||||||||
2025/07/05:21h50m UTC |
| ||||||||||||||||||||||||||||
Nikko(Fukujin) | |||||||||||||||||||||||||||||
| Lat. : 23.075 | |||||||||||||||||||||||||||||
| Long. : 142.308 | |||||||||||||||||||||||||||||
| Height(m) : _ | |||||||||||||||||||||||||||||
| annual chart (download textdata [1.6] [2.3] [3.9] [11] ) |
Latest Image 2025/07/05:21h50m UTC
| ||||||||||||||||||||||||||||
 | |||||||||||||||||||||||||||||
 | |||||||||||||||||||||||||||||
| show monthly chart | show daily chart | ||||||||||||||||||||||||||||
2025/07/05:21h50m UTC |
| ||||||||||||||||||||||||||||
Farallon De Pajaros | |||||||||||||||||||||||||||||
| Lat. : 20.53 | |||||||||||||||||||||||||||||
| Long. : 144.9 | |||||||||||||||||||||||||||||
| Height(m) : _ | |||||||||||||||||||||||||||||
| annual chart (download textdata [1.6] [2.3] [3.9] [11] ) |
Latest Image 2025/07/05:21h50m UTC
| ||||||||||||||||||||||||||||
 | |||||||||||||||||||||||||||||
 | |||||||||||||||||||||||||||||
| show monthly chart | show daily chart | ||||||||||||||||||||||||||||
2025/07/05:21h50m UTC |
| ||||||||||||||||||||||||||||
Pagan | |||||||||||||||||||||||||||||
| Lat. : 18.13 | |||||||||||||||||||||||||||||
| Long. : 145.8 | |||||||||||||||||||||||||||||
| Height(m) : _ | |||||||||||||||||||||||||||||
| annual chart (download textdata [1.6] [2.3] [3.9] [11] ) |
Latest Image 2025/07/05:21h50m UTC
| ||||||||||||||||||||||||||||
 | |||||||||||||||||||||||||||||
 | |||||||||||||||||||||||||||||
| show monthly chart | show daily chart | ||||||||||||||||||||||||||||
2025/07/05:21h50m UTC |
| ||||||||||||||||||||||||||||
Anatahan | |||||||||||||||||||||||||||||
| Lat. : 16.347 | |||||||||||||||||||||||||||||
| Long. : 145.697 | |||||||||||||||||||||||||||||
| Height(m) : _ | |||||||||||||||||||||||||||||
| annual chart (download textdata [1.6] [2.3] [3.9] [11] ) |
Latest Image 2025/07/05:21h50m UTC
| ||||||||||||||||||||||||||||
 | |||||||||||||||||||||||||||||
 | |||||||||||||||||||||||||||||
| show monthly chart | show daily chart | ||||||||||||||||||||||||||||

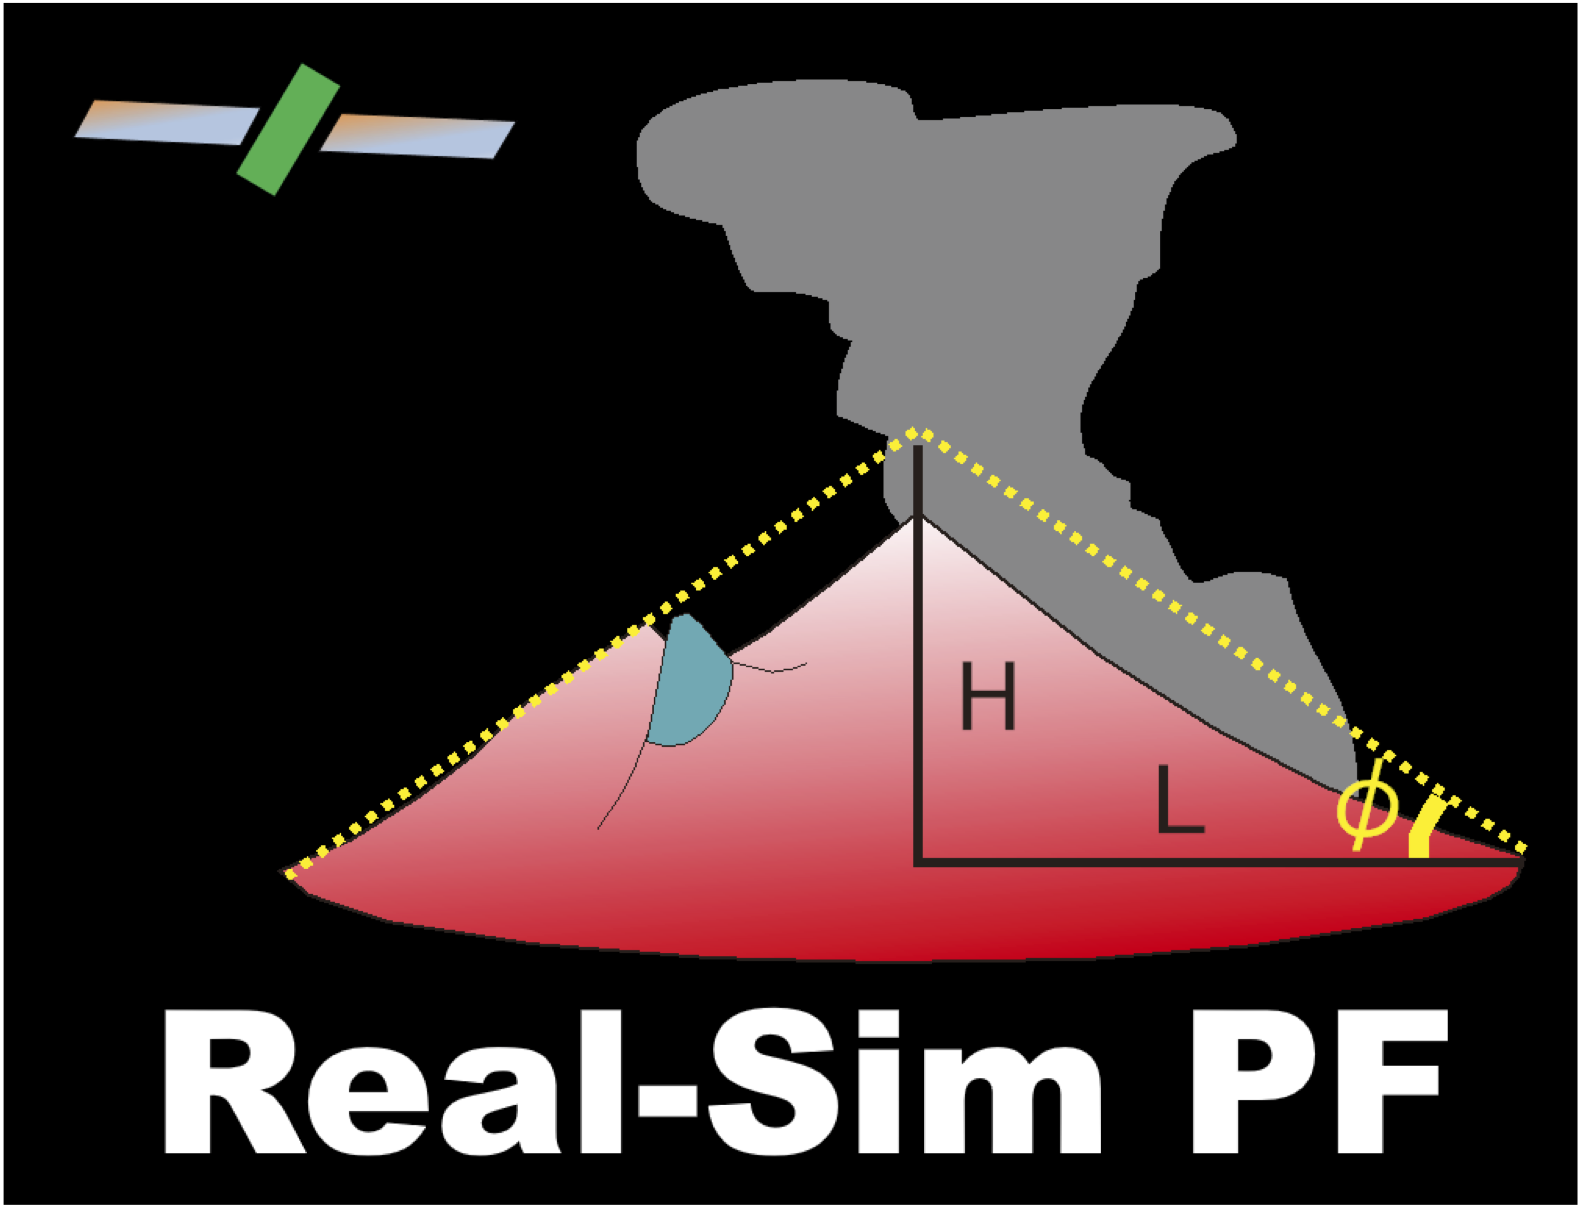 Go Energy_Cone