 |
Realvolc Home | GMS 地域選択 |
|
Realvolc Home | GMS 地域選択 |
2025/07/06:21h30m UTC |
| ||||||||||||||||||||||||||||
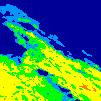
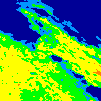
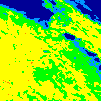
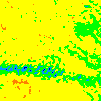
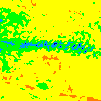
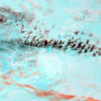
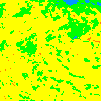
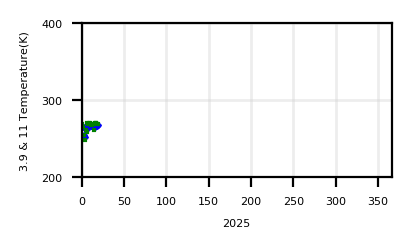
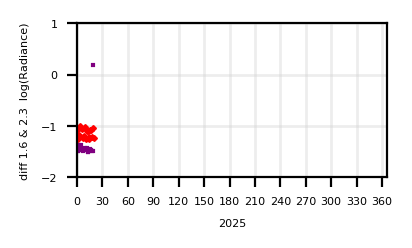
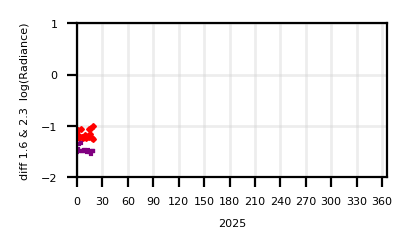
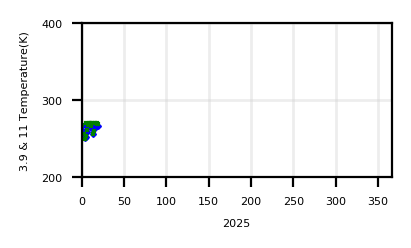
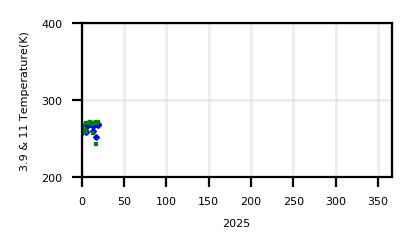
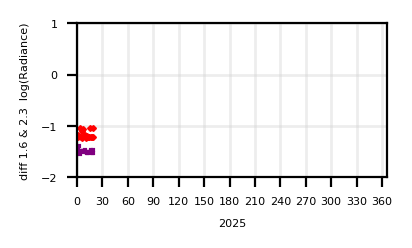
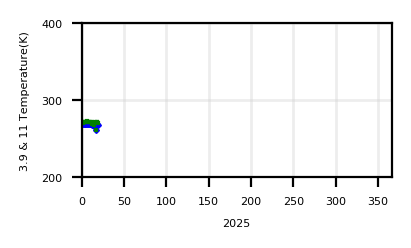
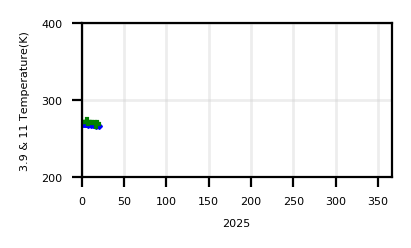
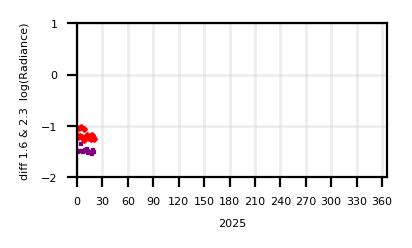
Alaid | |||||||||||||||||||||||||||||
| Lat. : 50.858 | |||||||||||||||||||||||||||||
| Long. : 155.55 | |||||||||||||||||||||||||||||
| Height(m) : 2339 | |||||||||||||||||||||||||||||
| annual chart (download textdata [1.6] [2.3] [3.9] [11] ) |
Latest Image 2025/07/06:21h30m UTC
| ||||||||||||||||||||||||||||
 | |||||||||||||||||||||||||||||
 | |||||||||||||||||||||||||||||
| show monthly chart | show daily chart | ||||||||||||||||||||||||||||
2025/07/06:21h30m UTC |
| ||||||||||||||||||||||||||||
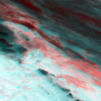
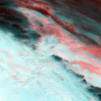
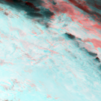
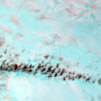
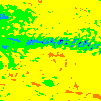
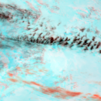
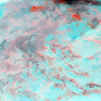
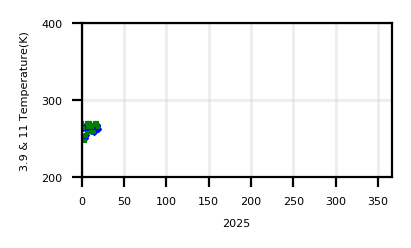
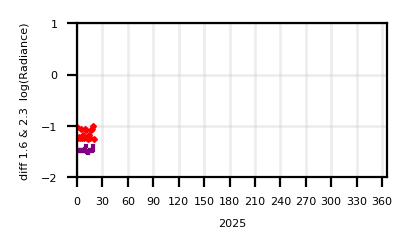
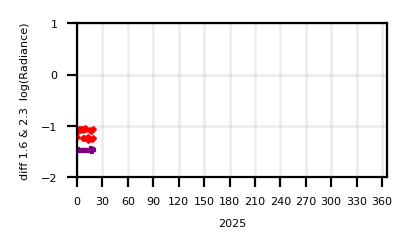
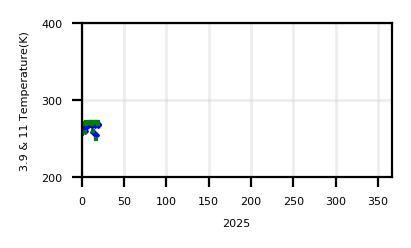
Ebeko | |||||||||||||||||||||||||||||
| Lat. : 50.68 | |||||||||||||||||||||||||||||
| Long. : 156.02 | |||||||||||||||||||||||||||||
| Height(m) : 1156 | |||||||||||||||||||||||||||||
| annual chart (download textdata [1.6] [2.3] [3.9] [11] ) |
Latest Image 2025/07/06:21h30m UTC
| ||||||||||||||||||||||||||||
 | |||||||||||||||||||||||||||||
 | |||||||||||||||||||||||||||||
| show monthly chart | show daily chart | ||||||||||||||||||||||||||||
2025/07/06:21h30m UTC |
| ||||||||||||||||||||||||||||
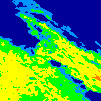
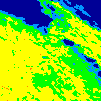
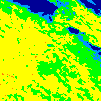
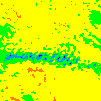
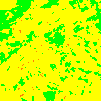
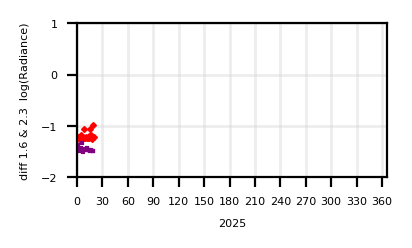
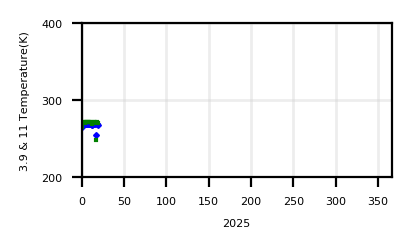
Chikurachki | |||||||||||||||||||||||||||||
| Lat. : 50.325 | |||||||||||||||||||||||||||||
| Long. : 155.458 | |||||||||||||||||||||||||||||
| Height(m) : 1816 | |||||||||||||||||||||||||||||
| annual chart (download textdata [1.6] [2.3] [3.9] [11] ) |
Latest Image 2025/07/06:21h30m UTC
| ||||||||||||||||||||||||||||
 | |||||||||||||||||||||||||||||
 | |||||||||||||||||||||||||||||
| show monthly chart | show daily chart | ||||||||||||||||||||||||||||
2025/07/06:21h30m UTC |
| ||||||||||||||||||||||||||||
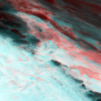
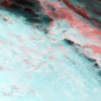
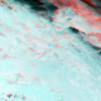
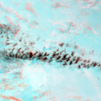
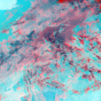
Karpinsky_Group | |||||||||||||||||||||||||||||
| Lat. : 50.13 | |||||||||||||||||||||||||||||
| Long. : 155.37 | |||||||||||||||||||||||||||||
| Height(m) : 1345 | |||||||||||||||||||||||||||||
| annual chart (download textdata [1.6] [2.3] [3.9] [11] ) |
Latest Image 2025/07/06:21h30m UTC
| ||||||||||||||||||||||||||||
 | |||||||||||||||||||||||||||||
 | |||||||||||||||||||||||||||||
| show monthly chart | show daily chart | ||||||||||||||||||||||||||||
2025/07/06:21h30m UTC |
| ||||||||||||||||||||||||||||
Nemo_Peak | |||||||||||||||||||||||||||||
| Lat. : 49.57 | |||||||||||||||||||||||||||||
| Long. : 154.808 | |||||||||||||||||||||||||||||
| Height(m) : 1018 | |||||||||||||||||||||||||||||
| annual chart (download textdata [1.6] [2.3] [3.9] [11] ) |
Latest Image 2025/07/06:21h30m UTC
| ||||||||||||||||||||||||||||
 | |||||||||||||||||||||||||||||
 | |||||||||||||||||||||||||||||
| show monthly chart | show daily chart | ||||||||||||||||||||||||||||
2025/07/06:21h30m UTC |
| ||||||||||||||||||||||||||||
Tao-Rusyr_Calde | |||||||||||||||||||||||||||||
| Lat. : 49.35 | |||||||||||||||||||||||||||||
| Long. : 154.7 | |||||||||||||||||||||||||||||
| Height(m) : 1325 | |||||||||||||||||||||||||||||
| annual chart (download textdata [1.6] [2.3] [3.9] [11] ) |
Latest Image 2025/07/06:21h30m UTC
| ||||||||||||||||||||||||||||
 | |||||||||||||||||||||||||||||
 | |||||||||||||||||||||||||||||
| show monthly chart | show daily chart | ||||||||||||||||||||||||||||
2025/07/06:21h30m UTC |
| ||||||||||||||||||||||||||||
Harimkotan | |||||||||||||||||||||||||||||
| Lat. : 49.12 | |||||||||||||||||||||||||||||
| Long. : 154.508 | |||||||||||||||||||||||||||||
| Height(m) : 1145 | |||||||||||||||||||||||||||||
| annual chart (download textdata [1.6] [2.3] [3.9] [11] ) |
Latest Image 2025/07/06:21h30m UTC
| ||||||||||||||||||||||||||||
 | |||||||||||||||||||||||||||||
 | |||||||||||||||||||||||||||||
| show monthly chart | show daily chart | ||||||||||||||||||||||||||||
2025/07/06:21h30m UTC |
| ||||||||||||||||||||||||||||
Chirinkotan | |||||||||||||||||||||||||||||
| Lat. : 48.98 | |||||||||||||||||||||||||||||
| Long. : 153.48 | |||||||||||||||||||||||||||||
| Height(m) : 724 | |||||||||||||||||||||||||||||
| annual chart (download textdata [1.6] [2.3] [3.9] [11] ) |
Latest Image 2025/07/06:21h30m UTC
| ||||||||||||||||||||||||||||
 | |||||||||||||||||||||||||||||
 | |||||||||||||||||||||||||||||
| show monthly chart | show daily chart | ||||||||||||||||||||||||||||
2025/07/06:21h30m UTC |
| ||||||||||||||||||||||||||||
Ekarma | |||||||||||||||||||||||||||||
| Lat. : 48.958 | |||||||||||||||||||||||||||||
| Long. : 153.93 | |||||||||||||||||||||||||||||
| Height(m) : 1170 | |||||||||||||||||||||||||||||
| annual chart (download textdata [1.6] [2.3] [3.9] [11] ) |
Latest Image 2025/07/06:21h30m UTC
| ||||||||||||||||||||||||||||
 | |||||||||||||||||||||||||||||
 | |||||||||||||||||||||||||||||
| show monthly chart | show daily chart | ||||||||||||||||||||||||||||
2025/07/06:21h30m UTC |
| ||||||||||||||||||||||||||||
Raikoke | |||||||||||||||||||||||||||||
| Lat. : 48.292 | |||||||||||||||||||||||||||||
| Long. : 153.25 | |||||||||||||||||||||||||||||
| Height(m) : 551 | |||||||||||||||||||||||||||||
| annual chart (download textdata [1.6] [2.3] [3.9] [11] ) |
Latest Image 2025/07/06:21h30m UTC
| ||||||||||||||||||||||||||||
 | |||||||||||||||||||||||||||||
 | |||||||||||||||||||||||||||||
| show monthly chart | show daily chart | ||||||||||||||||||||||||||||
2025/07/06:21h30m UTC |
| ||||||||||||||||||||||||||||
Sarychev_Peak | |||||||||||||||||||||||||||||
| Lat. : 48.092 | |||||||||||||||||||||||||||||
| Long. : 153.2 | |||||||||||||||||||||||||||||
| Height(m) : 1496 | |||||||||||||||||||||||||||||
| annual chart (download textdata [1.6] [2.3] [3.9] [11] ) |
Latest Image 2025/07/06:21h30m UTC
| ||||||||||||||||||||||||||||
 | |||||||||||||||||||||||||||||
 | |||||||||||||||||||||||||||||
| show monthly chart | show daily chart | ||||||||||||||||||||||||||||
2025/07/06:21h30m UTC |
| ||||||||||||||||||||||||||||
Rasshua | |||||||||||||||||||||||||||||
| Lat. : 47.77 | |||||||||||||||||||||||||||||
| Long. : 153.02 | |||||||||||||||||||||||||||||
| Height(m) : 956 | |||||||||||||||||||||||||||||
| annual chart (download textdata [1.6] [2.3] [3.9] [11] ) |
Latest Image 2025/07/06:21h30m UTC
| ||||||||||||||||||||||||||||
 | |||||||||||||||||||||||||||||
 | |||||||||||||||||||||||||||||
| show monthly chart | show daily chart | ||||||||||||||||||||||||||||
2025/07/06:21h30m UTC |
| ||||||||||||||||||||||||||||
Ketoi | |||||||||||||||||||||||||||||
| Lat. : 47.35 | |||||||||||||||||||||||||||||
| Long. : 152.475 | |||||||||||||||||||||||||||||
| Height(m) : 1172 | |||||||||||||||||||||||||||||
| annual chart (download textdata [1.6] [2.3] [3.9] [11] ) |
Latest Image 2025/07/06:21h30m UTC
| ||||||||||||||||||||||||||||
 | |||||||||||||||||||||||||||||
 | |||||||||||||||||||||||||||||
| show monthly chart | show daily chart | ||||||||||||||||||||||||||||
2025/07/06:21h30m UTC |
| ||||||||||||||||||||||||||||
Zavaritzki_Cald | |||||||||||||||||||||||||||||
| Lat. : 46.925 | |||||||||||||||||||||||||||||
| Long. : 151.95 | |||||||||||||||||||||||||||||
| Height(m) : 624 | |||||||||||||||||||||||||||||
| annual chart (download textdata [1.6] [2.3] [3.9] [11] ) |
Latest Image 2025/07/06:21h30m UTC
| ||||||||||||||||||||||||||||
 | |||||||||||||||||||||||||||||
 | |||||||||||||||||||||||||||||
| show monthly chart | show daily chart | ||||||||||||||||||||||||||||
2025/07/06:21h30m UTC |
| ||||||||||||||||||||||||||||
Goriaschaia_Sop | |||||||||||||||||||||||||||||
| Lat. : 46.83 | |||||||||||||||||||||||||||||
| Long. : 151.75 | |||||||||||||||||||||||||||||
| Height(m) : 891 | |||||||||||||||||||||||||||||
| annual chart (download textdata [1.6] [2.3] [3.9] [11] ) |
Latest Image 2025/07/06:21h30m UTC
| ||||||||||||||||||||||||||||
 | |||||||||||||||||||||||||||||
 | |||||||||||||||||||||||||||||
| show monthly chart | show daily chart | ||||||||||||||||||||||||||||
2025/07/06:21h30m UTC |
| ||||||||||||||||||||||||||||
Chirpoi | |||||||||||||||||||||||||||||
| Lat. : 46.525 | |||||||||||||||||||||||||||||
| Long. : 150.875 | |||||||||||||||||||||||||||||
| Height(m) : 742 | |||||||||||||||||||||||||||||
| annual chart (download textdata [1.6] [2.3] [3.9] [11] ) |
Latest Image 2025/07/06:21h30m UTC
| ||||||||||||||||||||||||||||
 | |||||||||||||||||||||||||||||
 | |||||||||||||||||||||||||||||
| show monthly chart | show daily chart | ||||||||||||||||||||||||||||
2025/07/06:21h30m UTC |
| ||||||||||||||||||||||||||||
Kolokol_Group | |||||||||||||||||||||||||||||
| Lat. : 46.042 | |||||||||||||||||||||||||||||
| Long. : 150.05 | |||||||||||||||||||||||||||||
| Height(m) : 1328 | |||||||||||||||||||||||||||||
| annual chart (download textdata [1.6] [2.3] [3.9] [11] ) |
Latest Image 2025/07/06:21h30m UTC
| ||||||||||||||||||||||||||||
 | |||||||||||||||||||||||||||||
 | |||||||||||||||||||||||||||||
| show monthly chart | show daily chart | ||||||||||||||||||||||||||||
2025/07/06:21h30m UTC |
| ||||||||||||||||||||||||||||
Medvezhia | |||||||||||||||||||||||||||||
| Lat. : 45.38 | |||||||||||||||||||||||||||||
| Long. : 148.83 | |||||||||||||||||||||||||||||
| Height(m) : 1124 | |||||||||||||||||||||||||||||
| annual chart (download textdata [1.6] [2.3] [3.9] [11] ) |
Latest Image 2025/07/06:21h30m UTC
| ||||||||||||||||||||||||||||
 | |||||||||||||||||||||||||||||
 | |||||||||||||||||||||||||||||
| show monthly chart | show daily chart | ||||||||||||||||||||||||||||
2025/07/06:21h30m UTC |
| ||||||||||||||||||||||||||||
Baransky | |||||||||||||||||||||||||||||
| Lat. : 45.1 | |||||||||||||||||||||||||||||
| Long. : 148.02 | |||||||||||||||||||||||||||||
| Height(m) : 1125 | |||||||||||||||||||||||||||||
| annual chart (download textdata [1.6] [2.3] [3.9] [11] ) |
Latest Image 2025/07/06:21h30m UTC
| ||||||||||||||||||||||||||||
 | |||||||||||||||||||||||||||||
 | |||||||||||||||||||||||||||||
| show monthly chart | show daily chart | ||||||||||||||||||||||||||||
2025/07/06:21h30m UTC |
| ||||||||||||||||||||||||||||
Grozny_Group | |||||||||||||||||||||||||||||
| Lat. : 45.02 | |||||||||||||||||||||||||||||
| Long. : 147.87 | |||||||||||||||||||||||||||||
| Height(m) : 1158 | |||||||||||||||||||||||||||||
| annual chart (download textdata [1.6] [2.3] [3.9] [11] ) |
Latest Image 2025/07/06:21h30m UTC
| ||||||||||||||||||||||||||||
 | |||||||||||||||||||||||||||||
 | |||||||||||||||||||||||||||||
| show monthly chart | show daily chart | ||||||||||||||||||||||||||||
2025/07/06:21h30m UTC |
| ||||||||||||||||||||||||||||
Tyatya | |||||||||||||||||||||||||||||
| Lat. : 44.358 | |||||||||||||||||||||||||||||
| Long. : 146.27 | |||||||||||||||||||||||||||||
| Height(m) : 1855 | |||||||||||||||||||||||||||||
| annual chart (download textdata [1.6] [2.3] [3.9] [11] ) |
Latest Image 2025/07/06:21h30m UTC
| ||||||||||||||||||||||||||||
 | |||||||||||||||||||||||||||||
 | |||||||||||||||||||||||||||||
| show monthly chart | show daily chart | ||||||||||||||||||||||||||||

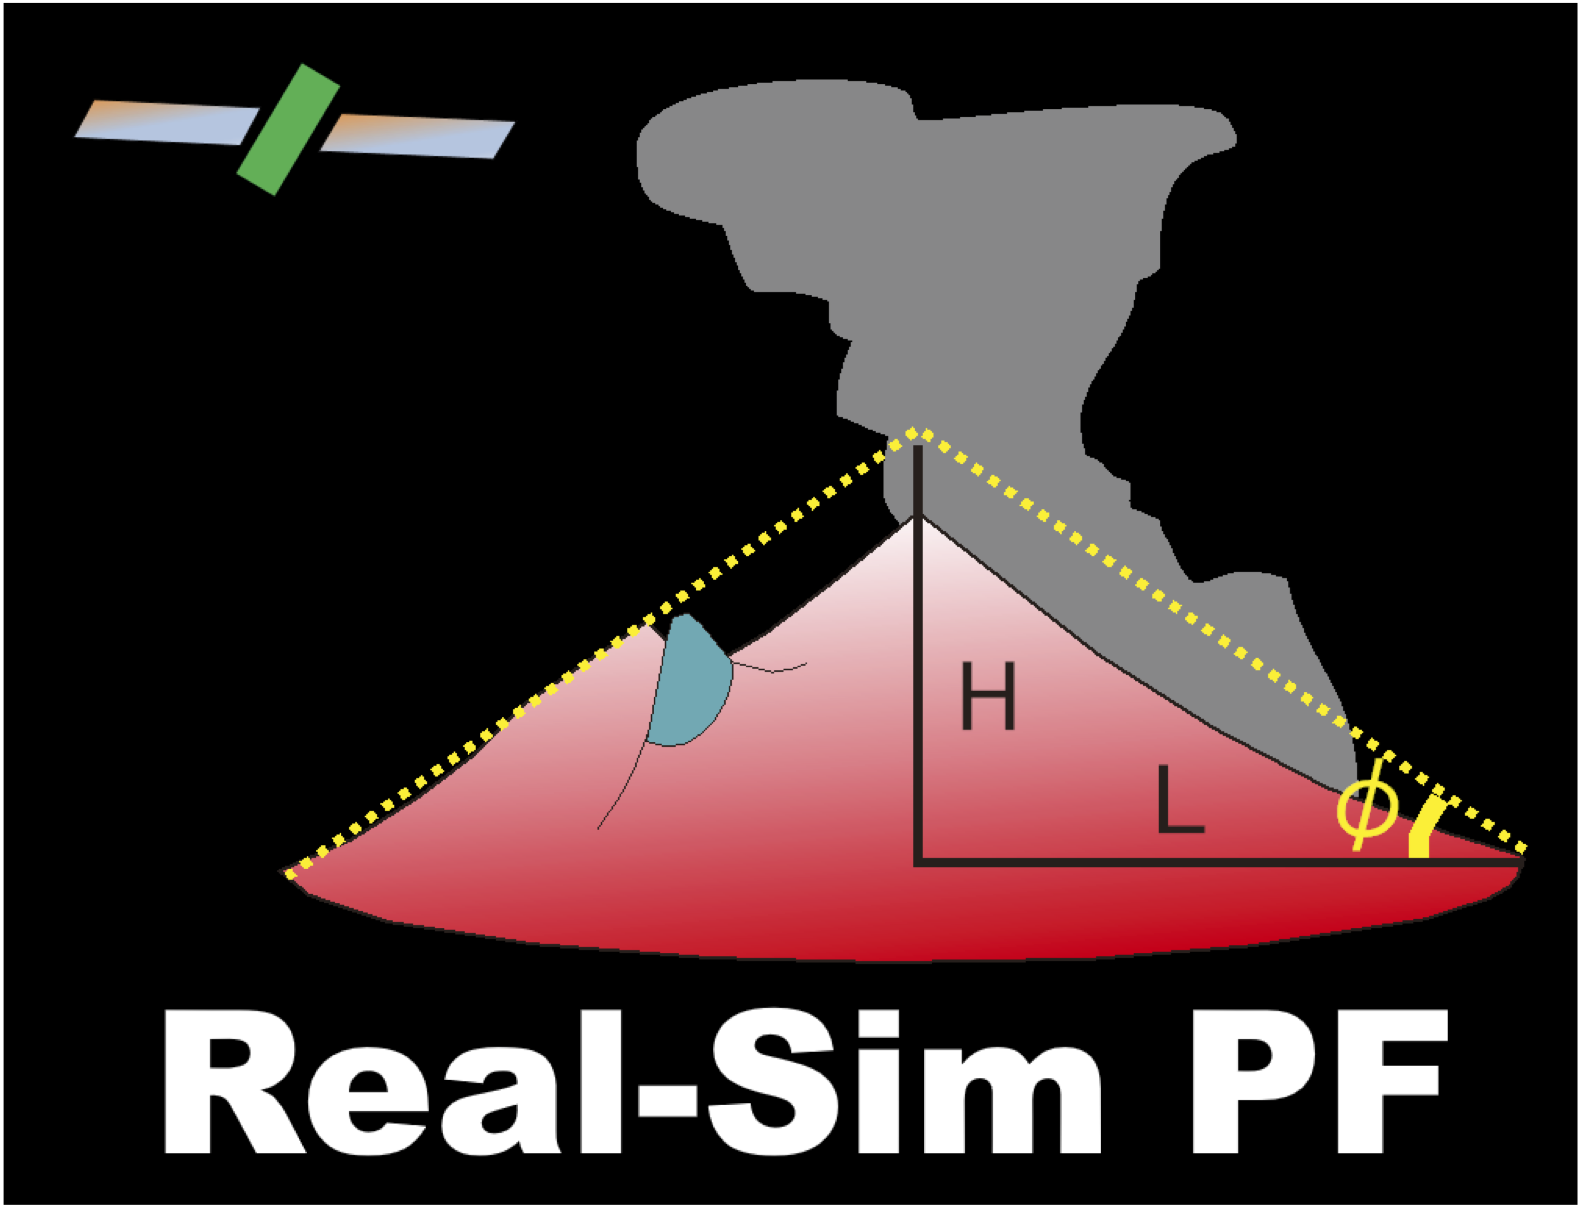 Go Energy_Cone