VRS-ERI Realvolc Home GMS 地域選択

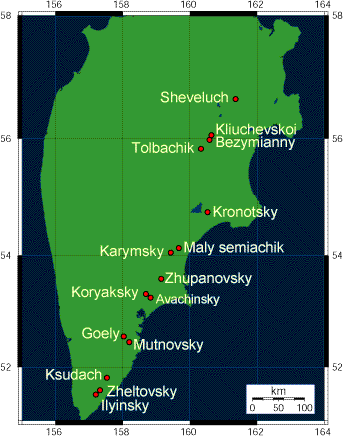
Kamchatka

UPDATE: 2025-01-21 19:39:18 (JST, +9h UTC)
[ Sheveluch ][ Kliuchevskoi ][ Bezymianny ][ Tolbachik ][ Kronotsky ][ Maly_Semiachik ][ Karymsky ][ Zhupanovsky ][ Koryaksky ][ Avachinsky ][ Gorely ][ Mutnovsky ][ Ksudach ][ Zheltovsky ][ Ilyinsky ]

Pickup images / data

Select volcano's radio button and press Pickup to open a whole day's images or text data.
yearmonthdayimages
text data

2025/01/21:08h40m UTC

Highest Alert levels (Nighttime)
-7 days-6 days-5 days -4 days -3 days -2 days -1 days TodayLive

Sheveluch

Lat. : 56.653
Long. : 161.36
Height(m) : 3283

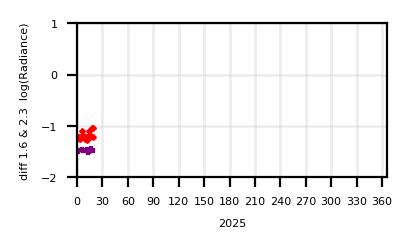
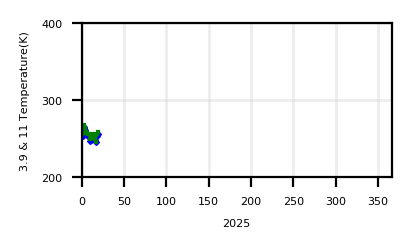
annual chart (download textdata [1.6] [2.3] [3.9] [11] )

Latest Image 2025/01/21:08h40m UTC

3.9umRGB(3.9:11:11-12)
Go Energy_Cone Go Lavaflow  
show monthly chart show daily chart

2025/01/21:08h40m UTC

Highest Alert levels (Nighttime)
-7 days-6 days-5 days -4 days -3 days -2 days -1 days TodayLive

Kliuchevskoi

Lat. : 56.057
Long. : 160.638
Height(m) : 4835

annual chart (download textdata [1.6] [2.3] [3.9] [11] )

Latest Image 2025/01/21:08h40m UTC

3.9umRGB(3.9:11:11-12)
Go Energy_Cone Go Lavaflow  
show monthly chart show daily chart

2025/01/21:08h40m UTC

Highest Alert levels (Nighttime)
-7 days-6 days-5 days -4 days -3 days -2 days -1 days TodayLive

Bezymianny

Lat. : 55.978
Long. : 160.587
Height(m) : 2882

annual chart (download textdata [1.6] [2.3] [3.9] [11] )

Latest Image 2025/01/21:08h40m UTC

3.9umRGB(3.9:11:11-12)
Go Energy_Cone Go Lavaflow  
show monthly chart show daily chart

2025/01/21:08h40m UTC

Highest Alert levels (Nighttime)
-7 days-6 days-5 days -4 days -3 days -2 days -1 days TodayLive

Tolbachik

Lat. : 55.83
Long. : 160.33
Height(m) : 3682

annual chart (download textdata [1.6] [2.3] [3.9] [11] )

Latest Image 2025/01/21:08h40m UTC

3.9umRGB(3.9:11:11-12)
Go Energy_Cone Go Lavaflow  
show monthly chart show daily chart

2025/01/21:08h40m UTC

Highest Alert levels (Nighttime)
-7 days-6 days-5 days -4 days -3 days -2 days -1 days TodayLive

Kronotsky

Lat. : 54.753
Long. : 160.527
Height(m) : 3528

annual chart (download textdata [1.6] [2.3] [3.9] [11] )

Latest Image 2025/01/21:08h40m UTC

3.9umRGB(3.9:11:11-12)
Go Energy_Cone Go Lavaflow  
show monthly chart show daily chart

2025/01/21:08h40m UTC

Highest Alert levels (Nighttime)
-7 days-6 days-5 days -4 days -3 days -2 days -1 days TodayLive

Maly_Semiachik

Lat. : 54.13
Long. : 159.67
Height(m) : 1560

annual chart (download textdata [1.6] [2.3] [3.9] [11] )

Latest Image 2025/01/21:08h40m UTC

3.9umRGB(3.9:11:11-12)
Go Energy_Cone Go Lavaflow  
show monthly chart show daily chart

2025/01/21:08h40m UTC

Highest Alert levels (Nighttime)
-7 days-6 days-5 days -4 days -3 days -2 days -1 days TodayLive

Karymsky

Lat. : 54.05
Long. : 159.43
Height(m) : 1486

annual chart (download textdata [1.6] [2.3] [3.9] [11] )

Latest Image 2025/01/21:08h40m UTC

3.9umRGB(3.9:11:11-12)
Go Energy_Cone Go Lavaflow  
show monthly chart show daily chart

2025/01/21:08h40m UTC

Highest Alert levels (Nighttime)
-7 days-6 days-5 days -4 days -3 days -2 days -1 days TodayLive

Zhupanovsky

Lat. : 53.59
Long. : 159.147
Height(m) : 2958

annual chart (download textdata [1.6] [2.3] [3.9] [11] )

Latest Image 2025/01/21:08h40m UTC

3.9umRGB(3.9:11:11-12)
Go Energy_Cone Go Lavaflow  
show monthly chart show daily chart

2025/01/21:08h40m UTC

Highest Alert levels (Nighttime)
-7 days-6 days-5 days -4 days -3 days -2 days -1 days TodayLive

Koryaksky

Lat. : 53.32
Long. : 158.688
Height(m) : 3456

annual chart (download textdata [1.6] [2.3] [3.9] [11] )

Latest Image 2025/01/21:08h40m UTC

3.9umRGB(3.9:11:11-12)
Go Energy_Cone Go Lavaflow  
show monthly chart show daily chart

2025/01/21:08h40m UTC

Highest Alert levels (Nighttime)
-7 days-6 days-5 days -4 days -3 days -2 days -1 days TodayLive

Avachinsky

Lat. : 53.255
Long. : 158.83
Height(m) : 2741

annual chart (download textdata [1.6] [2.3] [3.9] [11] )

Latest Image 2025/01/21:08h40m UTC

3.9umRGB(3.9:11:11-12)
Go Energy_Cone Go Lavaflow  
show monthly chart show daily chart

2025/01/21:08h40m UTC

Highest Alert levels (Nighttime)
-7 days-6 days-5 days -4 days -3 days -2 days -1 days TodayLive

Gorely

Lat. : 52.558
Long. : 158.03
Height(m) : 1829

annual chart (download textdata [1.6] [2.3] [3.9] [11] )

Latest Image 2025/01/21:08h40m UTC

3.9umRGB(3.9:11:11-12)
Go Energy_Cone Go Lavaflow  
show monthly chart show daily chart

2025/01/21:08h40m UTC

Highest Alert levels (Nighttime)
-7 days-6 days-5 days -4 days -3 days -2 days -1 days TodayLive

Mutnovsky

Lat. : 52.453
Long. : 158.195
Height(m) : 2322

annual chart (download textdata [1.6] [2.3] [3.9] [11] )

Latest Image 2025/01/21:08h40m UTC

3.9umRGB(3.9:11:11-12)
Go Energy_Cone Go Lavaflow  
show monthly chart show daily chart

2025/01/21:08h40m UTC

Highest Alert levels (Nighttime)
-7 days-6 days-5 days -4 days -3 days -2 days -1 days TodayLive

Ksudach

Lat. : 51.8
Long. : 157.53
Height(m) : 1079

annual chart (download textdata [1.6] [2.3] [3.9] [11] )

Latest Image 2025/01/21:08h40m UTC

3.9umRGB(3.9:11:11-12)
Go Energy_Cone Go Lavaflow  
show monthly chart show daily chart

2025/01/21:08h40m UTC

Highest Alert levels (Nighttime)
-7 days-6 days-5 days -4 days -3 days -2 days -1 days TodayLive

Zheltovsky

Lat. : 51.57
Long. : 157.323
Height(m) : 1953

annual chart (download textdata [1.6] [2.3] [3.9] [11] )

Latest Image 2025/01/21:08h40m UTC

3.9umRGB(3.9:11:11-12)
Go Energy_Cone Go Lavaflow  
show monthly chart show daily chart

2025/01/21:08h40m UTC

Highest Alert levels (Nighttime)
-7 days-6 days-5 days -4 days -3 days -2 days -1 days TodayLive

Ilyinsky

Lat. : 51.49
Long. : 157.2
Height(m) : 1578

annual chart (download textdata [1.6] [2.3] [3.9] [11] )

Latest Image 2025/01/21:08h40m UTC

3.9umRGB(3.9:11:11-12)
Go Energy_Cone Go Lavaflow  
show monthly chart show daily chart